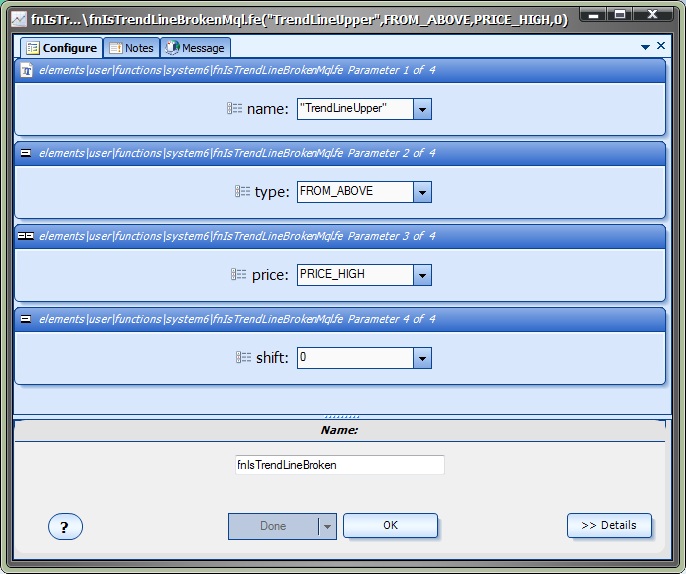
The fnIsTrendLineBroken function is used to determine if a price value has broken through a trend line.
After the fnIsTrendLineBroken function has been added to a Drawing, it is configured by clicking the (+) button along the bottom of the Element.
The Function Configuration window allows you to select values for each parameter.
Parameter Name |
Data type |
Description |
name |
string |
The name of the trend line. All trend lines are identified by name. The name should be unique. The pull-down menu provides sample names, but the text can be overwritten to any allowable name. The name must be surrounded by double quotes, for example "myName". Avoid using blank spaces in the name: It may cause unpredictable behaviour. |
type |
FROM value (integer) |
The direction from which the price value was broken. The pull-down menu offers these choices: FROM_ABOVE : The price value broke the trend line from above the line. FROM_BELOW : The price value broke the trend line from below the line. |
price |
double |
The price value to use to determine if the price has broken through the trend line. The pull-down menu offers these choices: Ask Bid PRICE_CLOSE PRICE_OPEN PRICE_HIGH PRICE_LOW PRICE_MEDIAN PRICE_TYPICAL PRICE_WEIGHTED |
shift |
integer |
The candle index on the price chart of where to test if the trend line has been broken. Zero is the currently forming candle, one is one candle to the left, etc. |


