Money Manager Configuration
- Money Manager configuration is accessed through the Money Manager System Manager.
- There are two tabs available: Configure and Simulate.
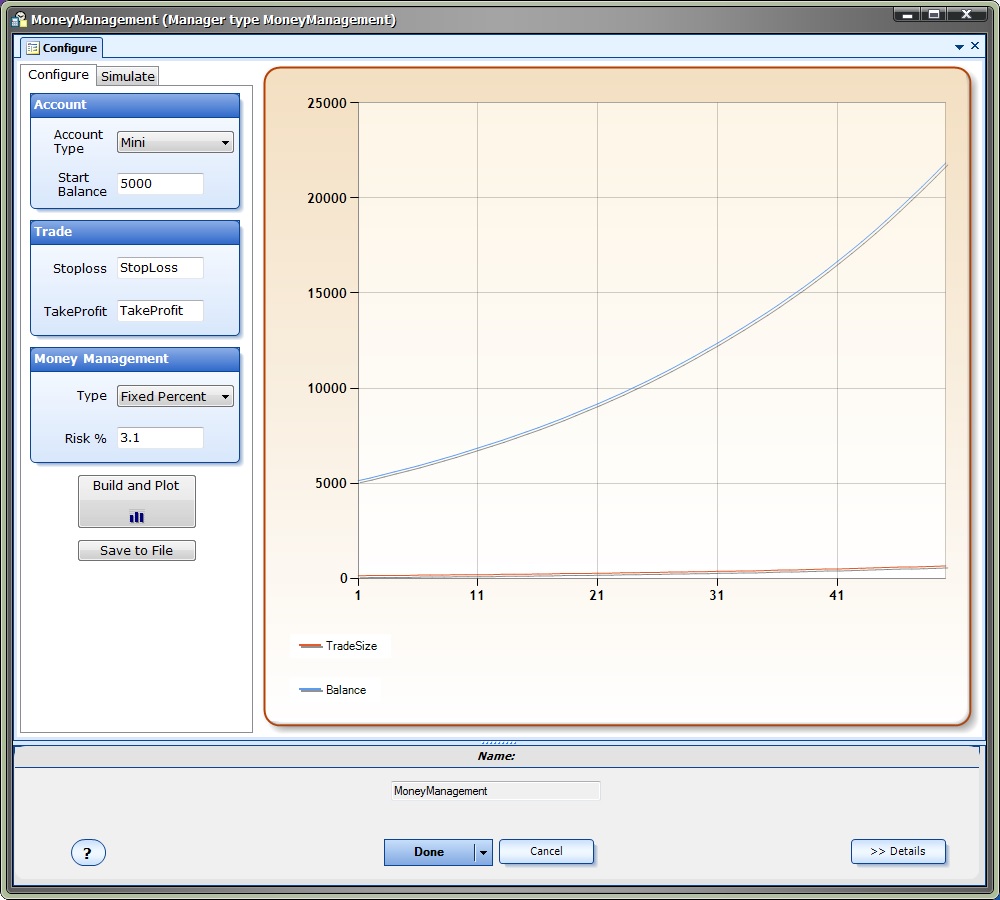
- The Configure area is used to define the Money Manager parameters
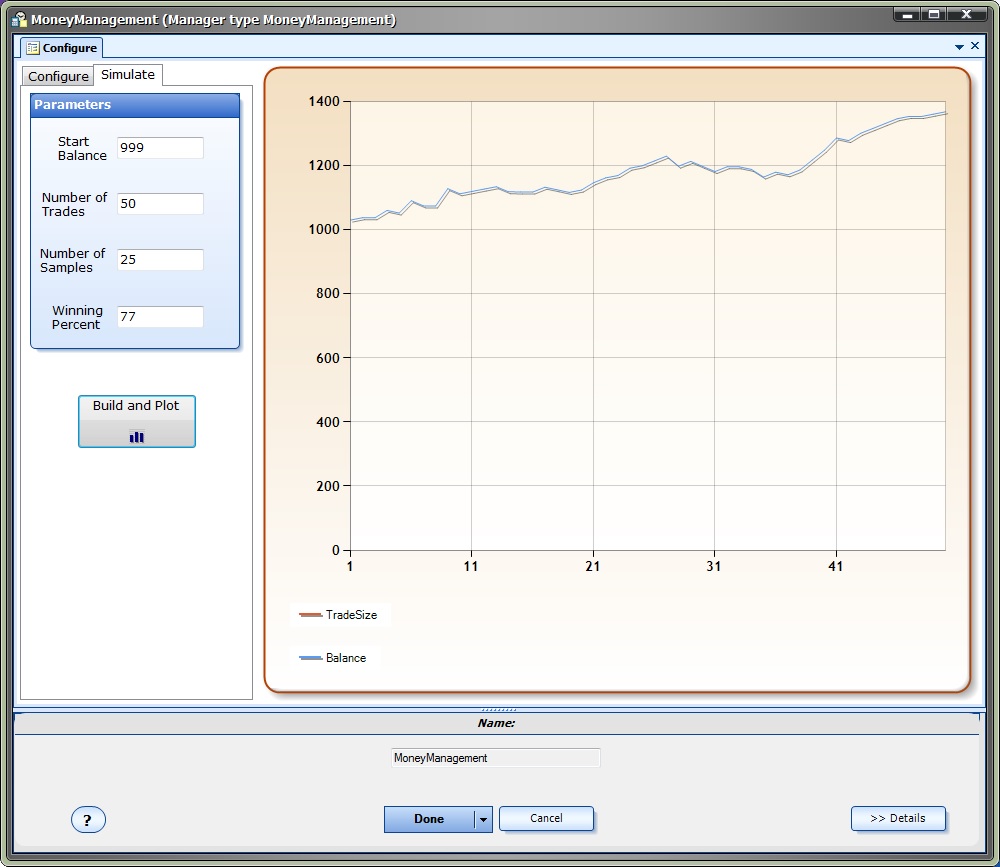
- The Simulate area is used to generate Monte Carlo simulations to view the likely equity curve of the strategy.
Configure Parameters
Section |
Parameter Name |
Value |
Description |
Account |
|||
Account Type |
Micro, Mini or Standard |
The account type will effect the value of one point as well as the minimum and maximum lot sizes. For reference, the value of one point on a EURUSD chart is: Standard: $10.00 Mini: $1.00 Micro: $ 0.10 |
|
Start Balance |
Any value greater than 0 |
The starting balance. This value, along with the stoploss, is used to determine the starting lot size. |
|
Trade |
|||
Stoploss |
Any value greater than 0 Any VTS Variable |
The stoploss is used to define the maximum lot size for a given risk value. On a per trade basis, the stoploss is viewed as the maximum allowable loss. |
|
TakeProfit |
Any value greater than 0 Any VTS Variable |
The takeprofit is only used during simulation to apply profitable trades to the account balance. The takeprofit is not used to calculate lot size. |
|
Money Management |
|||
Type |
Fixed Fixed Percent Fixed Ratio |
Fixed uses the same lot size for any account balance. Fixed Percent calculates the lot size using the stoploss (to define maximum allowable loss for a risk percentage) and the current balance. Fixed Ratio calculates the lot size using the delta* value. |
|
Risk % or Delta |
Any value greater than 0 |
The percent amount of the current balance that can be lost on a single trade, or the delta* value. |
|
* The Fixed Ratio method is further defined in our ebook Automatic Alpha, by David Williams. Here is an excerpt:
The Fixed Ratio method allows the account to grow aggressively in the beginning,
assuming more risk, and gradually reduces risk as the account size grows. The main
principle behind Fixed Ratio is that the relationship between the number of lots traded
and the amount of profit needed to increase the number of lots traded remains fixed.
For example, if a trader’s money management method is to trade one (full-sized) lot and
requires $10,000 USD of profit to increase to (2) two lots, then the Fixed Ratio method
would required an additional $20,000 USD of profit to increase to the next level, that is,
to (3) three lots.
The ratio between the number of lots traded and the amount of profit required to increase
the number of lots is fixed. In Jones’ method, the amount of profit required to increase
the number of lots traded is referred to as Delta. Once a trader chooses a value of Delta
appropriate for their risk tolerance, the entire money management scheme can be fully
described.
For example, suppose a trader opens a (mini) account with $2000 USD.
- The trader chooses to begin trading with a lot size of (1) mini-lot. (One mini-lot is
- the minimum lot size that can be traded).
- The trader chooses a Delta value of $200 USD.
The account level at which the trader increases their lot size to (2) lots is $2,200 USD.
The account level at which the trader increases their lot size to (3) lots is $2,600 USD.
The account level at which the trader increases their lot size to (4) lots is $3,200 USD.
This Fixed Ratio relationship can be expressed as:
The New Account Level to Increase Trade Size by One Lot =
Starting Account Value + (Delta x Number of Current Lots)
For more information, read The Trading Game, by Ryan Jones. He is the original developer of the Fixed Ratio method.

To generate an equity curve.click the "Build and Plot" button.
- This plots the equity using winning trades only.
- By default, the result of 50 trades is shown. The purpose of the equity graph is to display the relative strength of different money management configurations.
- The "Build and Plot" button should be clicked after any changes have been made to any of the parameters.
- A table is built that assembles the lot size for each level of the account balance.
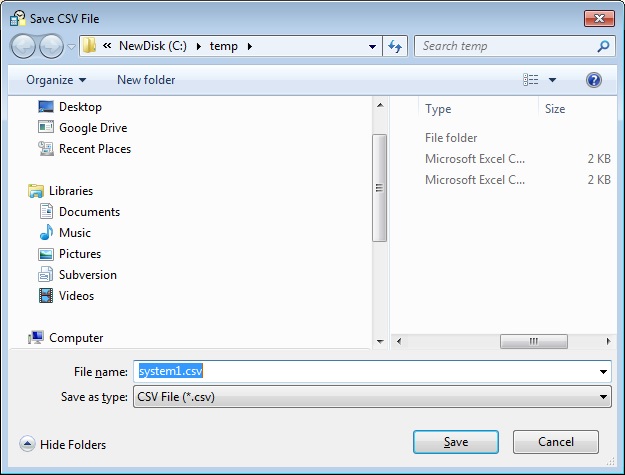
- This table can be saved as a Comma Separated File (CSV) by clicking the "Save to File" button:

Simulate Parameters
Parameter Name |
Value |
Description |
Start Balance |
Any value greater than 0 |
The starting balance |
Number of Trades |
Any value greater than 0 |
The number of trades to simulate* |
Number of Samples |
Any value greater than 0 |
The number of times to run the simulation* |
Winning Percent |
A value between 0 and 100 |
The winning percent of the trading system |
Theory
- The Monte Carlo simulation uses the wining percentage to define exactly how many trades will be profitable from the value entered in the 'Number of Trades'.
- The TakeProfit value from the configuration tab is used to define the amount of a winning trade.
- The StopLoss value from the configuration tab is used to define the amount of a losing trade.
- Each sample distributes the wins and losses randomly throughout the number of trades. The final plot shows the average of all sampled plots.
- Each time you click the "Build and Plot" button, the equity plot is redrawn. It should look different each time since the distribution of wins and losses is random.
- It is useful to set the Number of Trades to 1 and click the Build and Plot button several times: This displays the equity curve of a single run of the Expert Advisor, which is what most traders run.
- Monte Carlo simulation is useful when you know the winning percentage of your Expert Advisor, but you do not know the exact order of the wins and losses.
*Note: Large values of Number of Trades and/or Number of Samples may result in intensive CPU utilization.
The total number of simulations will equal the Number of Trades multiplied by Number of Samples


