Custom Indicators
- VTS searches for Custom Indicators in the MetaTrader Platform's Custom Indicator folder.
- The Custom Indicator folder is the "experts\indicators" folder beneath the platform installation folder.
- Any file with an extension of ex4 in the Custom Indicator folder is displayed in the Function Toolbox, under the menu Indicators-> Custom Indicators
- Custom Indicators are similar to platform functions, except:
- The parameters of a Custom Indicatormust be defined (if any)
- The output lines of a Custom Indicatormust be defined (if any)
- Custom Indicators are dragged and dropped onto the Drawing Pad like other Elements.
- If the parameters or output lines of a Custom Indicator have not been configured, selecting the configuration (+) button of a Custom Indicator Element will display the Custom Indicators Definition Window
- If the parameters or output lines of a Custom Indicator have been configured, selecting the configuration (+) button of a Custom Indicator Element will display the Function Configuration Window
Custom Indicators
- VTS searches for Custom Indicators in the MetaTrader Platform's Custom Indicator folder.
- The Custom Indicator folder is usually something like :
C:\Program File\MetaTrader4\experts\indicators (This depends on where you chose to install MetaTrader) - Any file with an extension of ex4 in the Custom Indicator folder is displayed in the Function Toolbox, under the menu Indicators-> Custom Indicators
- NOTE: If the Indicators->Custom Indicators menu in the VTSFunction Toolbox tab is empty, it's most likely because the MetaTrader MT Pathshave not been configured.
- To make your custom indicator available for selection from the VTSToolbox, simply copy the custom indicator file into the custom indicator folder.
- If the parameters or output lines of a Custom Indicator have not been configured, selecting the configuration (+) button of a Custom IndicatorElement will display the Custom Indicators Definition Window
- If the parameters or output lines of a Custom Indicator have been configured, selecting the configuration (+) button of a Custom IndicatorElement will display the Function Configuration Window
Using a Custom Indicator – The ZigZag Example
- As an example, we’ll define the InputVariables and Output Lines for the custom indicator ZigZag. The custom indicator ZigZag is included with the MetaTrader platform.
- Open the MetaTrader platform and attach the custom indicator ZigZag to any price chart. (From the Navigator window of the MetaTrader platform, expand “Custom Indicators” menu and double-click ZigZag.)
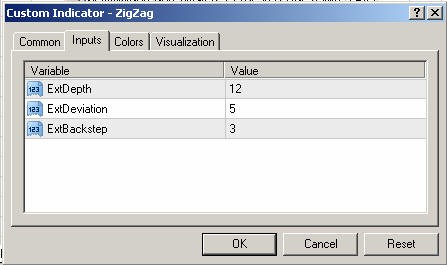
- When the indicator is attached to the price chart the following window, called the Indicator Configuration window, will appear. Leave this window open to help when entering the custom indicator’s Input Variablesand Output Lines into VTS.
- This is the Indicator Configuration window:.
- Start a or open a Trading System in VTS.
- Select the Functions Toolbox Tab and expand the Custom Indicators menu.
- This is the Toolbox with the Custom Indicators menu expanded:

- NOTE: If the folder Custom Indicators is not shown from within the VTS Functions Toolbox tab, it most likely because the MetaTrader MT Pathshas not yet been configured.
- Select the ZigZag custom indicator and drag it onto the VTS drawing pad.

- If the custom indicator has not been configured, selecting the configuration (+) button will display the Custom Indicator Definition window.
- The Custom Indicator Definition allows entry of the indicator's Input Variables and Output Lines.
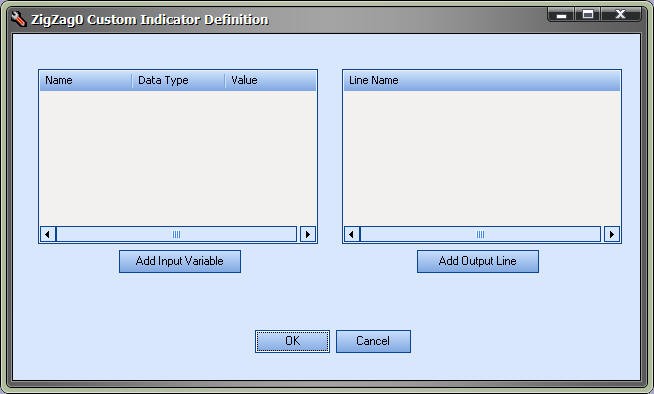
- Note, the input variables for your custom indicator are best identified from the Indicator Configuration window shown when attaching the indicator to a MetaTrader price chart.
- Select the Inputs tab to view the inputs.
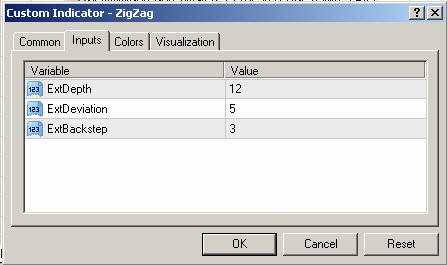
The Indicator Configuration window for the ZigZag indicator shows three input variables: ExtDepth, ExtDeviation and ExtBackstep.
The data type of all three variables is Integer, as identified by the “123” symbol to the far left.
The default value for ExtDepth is 12.
The default value for ExtDeviation is 5.
The default value for ExtBackstep is 3.
To add an input variable, select the Add Input Variable button.
Return to the Custom Indicator Definition window and select the Add Input Variable button. The Custom Indicator Input Definition window will be shown.
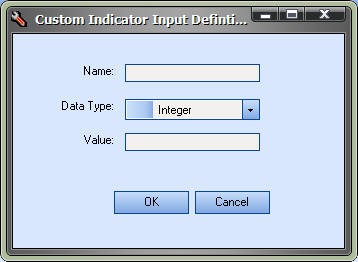
- Enter the values to define the Input variable ExtDepth:
- Enter the Name as ExtDepth.
- Select the Data Type as int.
- Enter the Value as 12.
- Select OK to save the values.
- Repeat this procedure for the other input variables ExtDeviation and ExtBackstep.
- To identify the various MQL data types, use the example below. Note the icon to the far left that defines the data type. In this example, the name of the data type is shown as the name of the variable.
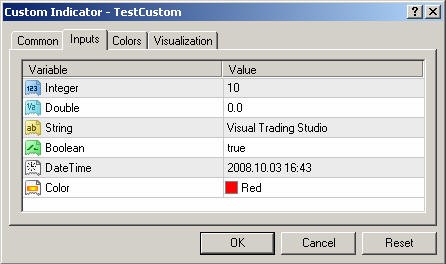
- To enter the output lines for the ZigZag indicator, refer back to the Indicator Configuration window.
- Select the Colors tab to view the output lines.
- The Indicator Configuration window for the ZigZag indicator shows one output line: Red.
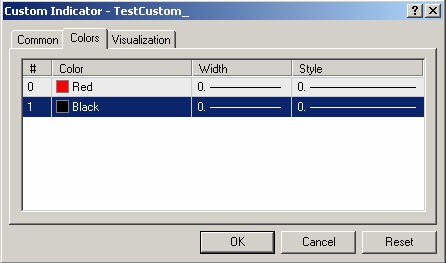
- To define the Red output line in VTS, return to the Custom Indicator Definition window and select the Add Output Line button.
- The Custom Indicator Line Definition window will be shown.
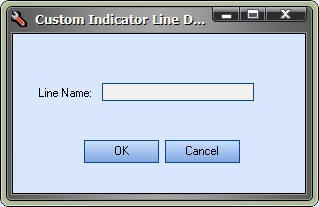
- Enter the value Red into the Line Name field and select OK.
- The final configuration is shown below.
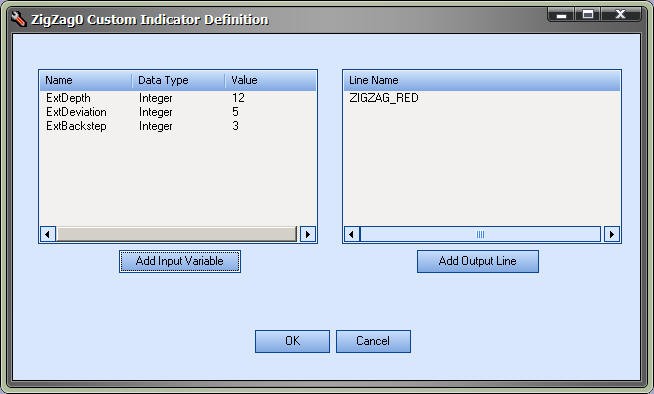
- If entering values for a custom indicator with more than one output line, be sure to enter the values in the same order as shown in the
Indicator Configuration window. - In the below example, note the number (in the # column) to the far left of the Color name.

- The ZigZag indicator can now be dragged from the VTS Toolbox onto the VTS Drawing Pad just like any other indicator. The information entered through the previous windows is used to prompt the user for the correct configuration information for the custom indicator.
- The Input Variables appear as input parameters.
- The Output Lines appear as selection items for the mode parameter.
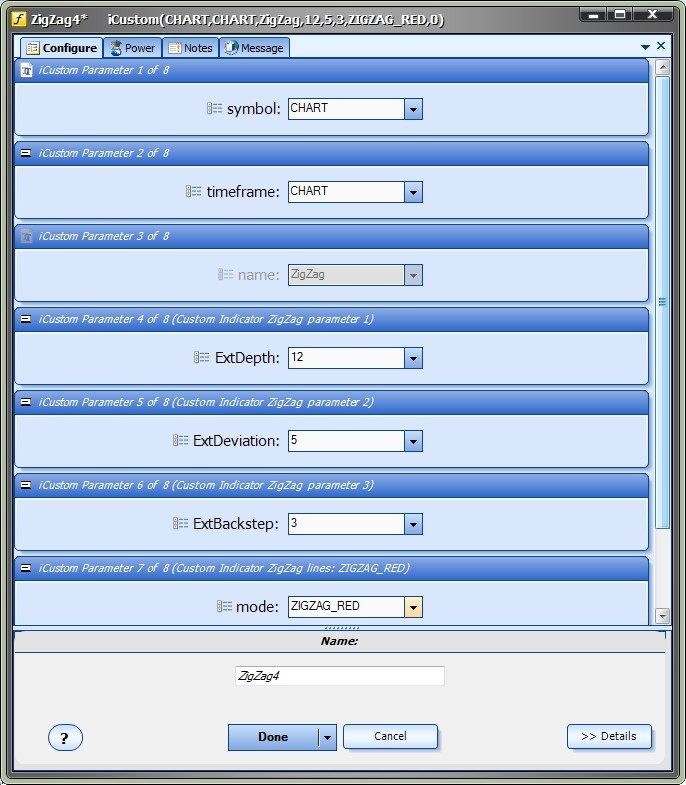
Note: If a mistake was made when entering any of the values, select the (i) button from the bottom of the ZigZag element to return to the Custom Indicator Definition window.

Appendix: The iCustom MQL Function
The information for the iCustom function is in the following table.
double iCustom(string symbol, int timeframe, string name, ..., int mode, int shift)
Calculates the specified custom indicator and returns its value. The custom indicator must be compiled (*.EX4 file) and be in the
terminal_directory\experts\indicators directory.
Parameters:
symbol - Symbol the data of which should be used to calculate indicator. NULL means current symbol.
timeframe - Timeframe. It can be any of Timeframe enumeration values. 0 means the current chart timeframe.
name - Custom indicator compiled program name.
... - Parameters set (if necessary). The passed parameters and their order must correspond with the
desclaration order and the type of extern variables of the custom indicator.
mode - Line index. Can be from 0 to 7 and must correspond with the index used by one of SetIndexBuffer
functions.
shift - Index of the value taken from the indicator buffer (shift relative to the current bar the given amount of
periods ago).
Sample:
double val=iCustom(NULL, 0, "SampleInd",13,1,0);
- What makes the iCustom function difficult to use is the fourth parameter. The ellipsis (…) indicates there can be zero to N number of parameters defined. The number depends on the specific custom indicator.
- The mode parameter is used to get the value of the specific line output of the custom indicator. Many indicators have more than one line drawn on the chart. This value must be defined correctly to receive the value of the correct line.
- The remaining parameters are straightforward.
- Note: An indicator does not need to be shown on a price chart to be used by an Expert Advisor.

