Building an Expert Advisor to draw and manage a trend line
The FX TrendLine Plug-in can programatically draw a trend line on a price chart using the fnDrawTrendLine function.
To build an Expert Advisor that opens a BUY trade when a programatically drawn trend line has been broken, drag and drop the TrendLine function fnDrawTrendLine on to the OpenBuyOrder drawing pad and connect it before the Logic element IsOpenBuyTrue.
Set the parameters of the fnDrawTrendLine function:
- Name: set the value of the name parameter to the name of the trend line. For example "mytrendline". This name will be referenced later in the fnIsTrendLineBroken function.
- ReDrawInterval: set the value of the ReDrawInterval parameter to desired redraw value:
- RD_ONCE : draw the line one time only
- RD_DAILY : redraw the line on each new day
- RD_HOURLY : redraw the line on each new hour
- RD_NEWBAR : redraw the line on each new bar
- RD_NEWTICK : redraw the line on each new tick
Note: A trend line is projected to the right indefinitely. It is not necessary to redraw the trend line unless the drawing coordinates change.
Four coordinates are required to draw a line in two dimensional space. For example, on a typical graph, using the Cartesion coordinate system, the coordinates are usually defined as (x1, y1) and (x2,y2).
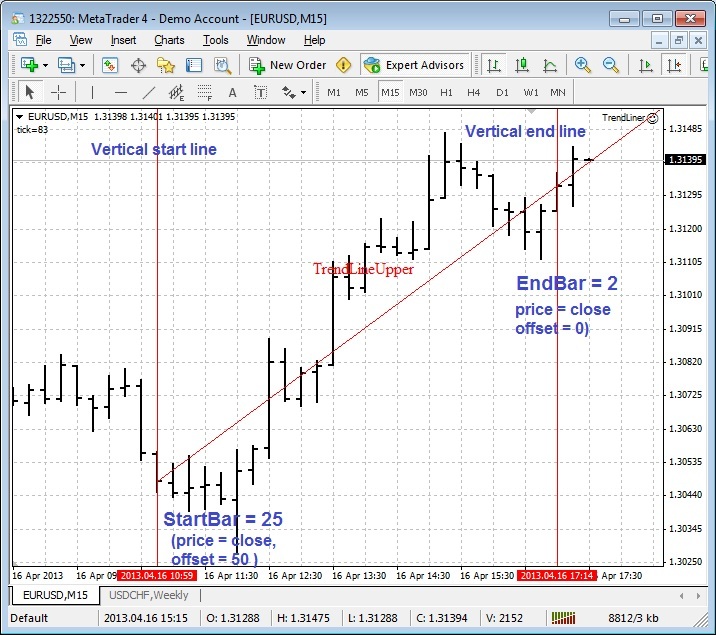
The primary coordinates of the trend line are defined as the StartBar, the StartPrice, the EndBar and the EndPrice.
- StartBar: set the value of the StartBar parameter to the bar (or candle) where the trend line should begin.
- NOTE: On a MetaTrader price chart, the currently forming candle is defined as candle 0 and the candle numbers increase to the left. Therefore, the StartBar is a larger number than the EndBar!
- StartPrice: set the value of the StartPrice parameter to a price value constant. The price is the vertical location where the line begins. The StartPrice is the price value of the StartBar.
- StartOffset: set the value of the StartOffset parameter to a positive or negative integer value (for example:10, 20, ...). The StartOffset value moves the vertical start location up or down relative to the StartPrice.
- EndBar: set the value of the EndBar parameter to the bar (or candle) where the trend line should end.
- NOTE: A trend line is projected to the right indefinitely regardless of where the EndBar is located. The EndBar simply defines the angle of the line, not its actual end point.
- EndPrice: set the value of the EndPrice parameter to a price value constant. The price is the vertical location where the trend line ends. The EndPrice is the price value of the EndPrice.
- NOTE: If the EndPrice is set as the Close, High, or Low of bar number 0, or to Ask or Bid, then the EndPrice may change value on each tick.
- EndOffset: set the value of the EndOffset parameter to a positive or negative integer value (for example:10, 20, ...). The EndOffset value moves the vertical end location up or down relative to the EndOffset.
- LineColor: optionally set the value of the LineColor parameter to a Color. The default is Black.
- DrawLabel: optionally set the value of the DrawLabel parameter to a true. (The default is false.) This will draw a label with the name of the trend line on the price chart. The label can be removed programatically using fnDeleteAllLabels, or manually from from the MetaTrader tool bar.
- DrawMarks: optionally set the value of the DrawMarks parameter to a true. (The default is false.) This will draw a vertical lines through the start and end bars. The vertical lines can be removed programatically using fnDeleteAllVerticalLines, or manually from from the MetaTrader tool bar.


