

Debug Manager on a VTS Drawing
This VTS drawings shows the Tick Watcher animation in progress. See the notes below for details.
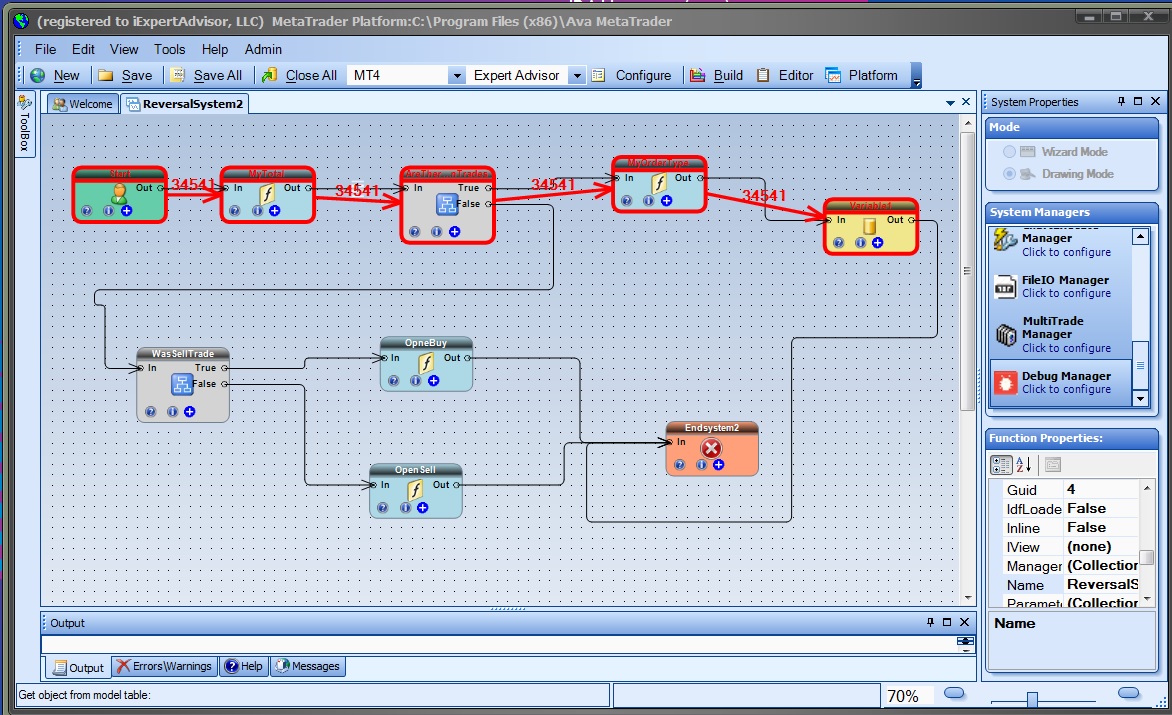
- The animation highlights the logical flow the EA is executing on each tick.
- Each Element appears in Red when it is executed.
- Each Link is animated in Red and displays the tick number used by VTS.
- The tick number is incremented each time the EA receives new price data.
- The tick number is shown on the price chart by default.
- To animate any drawing, including User Function Drawings, open the drawing and enable the Tick Watcher.