EA-Indicator Price Chart
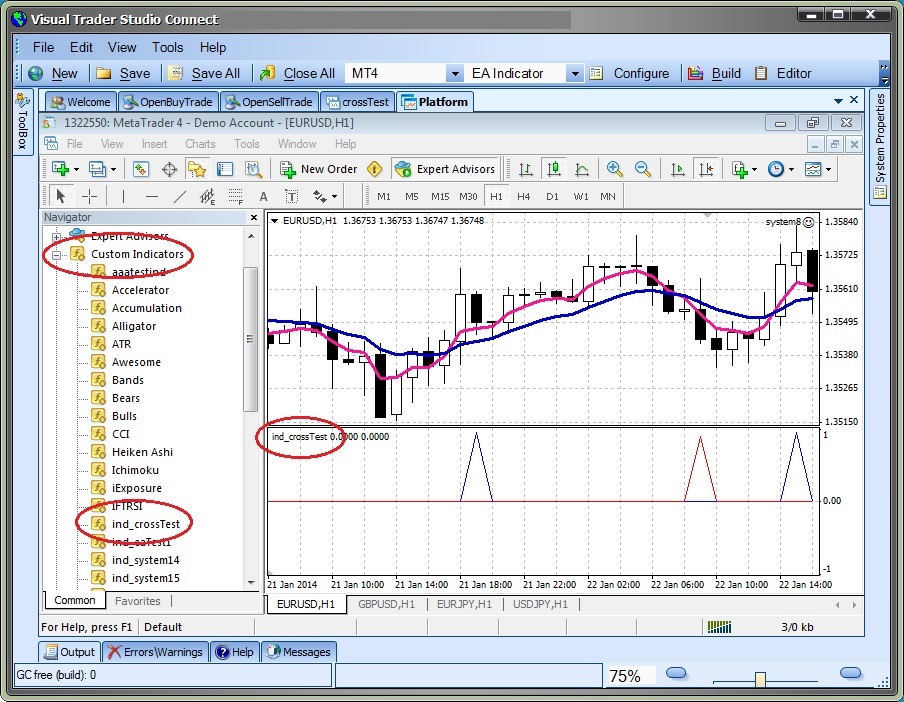
- The price chart below shows a custom indicator built from the Moving Average Crossover System.
- The ind_crossTest indicator is shown in the window below the price chart.
- On the price chart, the thick pink line is a fast moving average, the thick blue line is a slow moving average.
- When the fast moving average crosses the slow moving average trade signals are generated.
- The trade signals are seen as spikes in the red and blue lines in the lower indicator window.
- Note: The MetaTrader Platform may need to be closed and restarted before a newly created custom indicator appears in "Custom Indicators" folder of the Navigator window. This is a limitation of MetaTrader.