The fnDrawText is used to draw a label containing text on a price chart. It is positioned by price and candle.
After the fnDrawText function has been added to a Drawing, it is configured by clicking the (+) button along the bottom of the Element.
The Function Configuration window allows you to select values for each parameter.
Each Chart Object function offers a number of parameters on the Configuration Tab, and also a number of parameters on the Advanced Tab.
- Parameters on the Configuration Tab should be inspected and set each time the function is added to a drawing.
- Parameters on the Advanced Tab usually do not need to be changed from their default values.
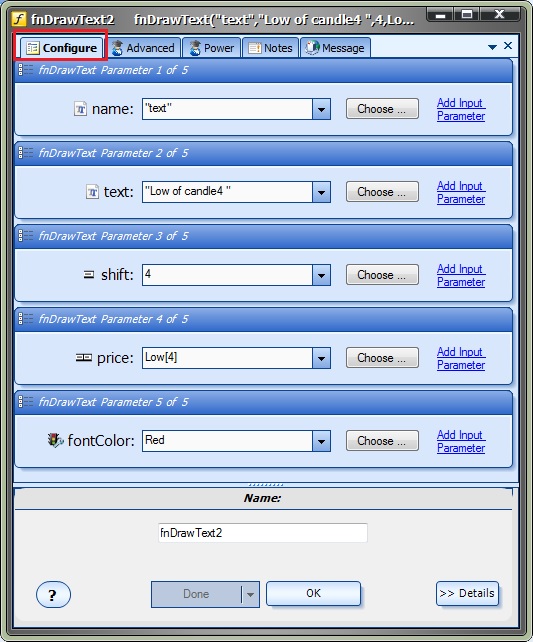
Parameters on the Configuration Tab
Parameter Name |
Data type |
Description |
name |
String |
The name of the object. Each object on a chart must have a unique name. Note: String parameters require enclosing quotes. Objects names can viewed from the MetaTrader platform by going to: Charts->Objects->Object List |
text |
String |
The text to be written on the chart. Note: String parameters require enclosing quotes |
shift |
Integer |
The candle shift used to position the object's vertical location on the price chart. |
price |
Double |
The price value used to position the object's horizontal location on the price chart. |
fontColor |
Color |
The color of the font. |
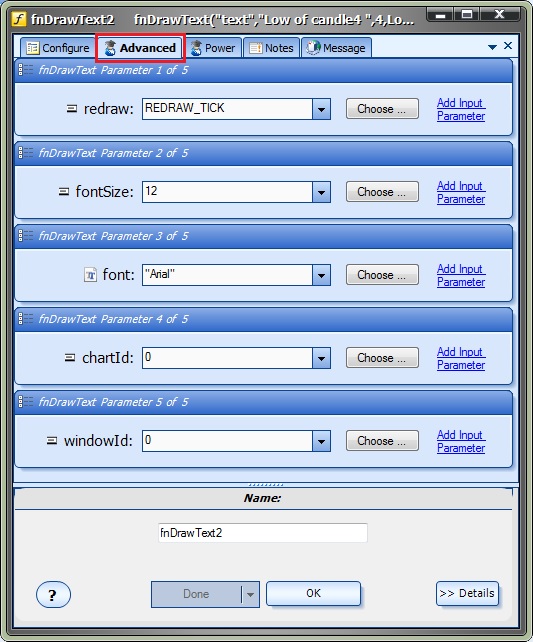
Parameters on the Advanced Tab
Parameter Name |
Data type |
Description |
redraw |
Integer |
The interval when to redraw the object. The pull-down menu offers these choices: REDRAW_ONCE: draw the object once only. REDRAW_BAR: redraw the object on each new bar. REDRAW_TICK: redraw the object on each new tick. Note: The object function must be connected on the drawing so that it executes on each tick for the redraw options to work correctly. Objects that use the shift parameter will move on the chart as new candles are formed. |
fontSize |
Integer |
The size of the font. |
font |
String |
The name of the font. |
chartID |
Integer |
The chart identifier. Use 0 for the current chart. |
windowID |
Integer |
The window identifier. Use 0 for the current window. |