Manually Drawing a Fibonacci Retracement


To manually draw a Fibonacci retracement on a MetaTrader price chart, click the Fibonacci retracement button, then click the start location on the chart, hold the mouse down while moving to the end location and release the mouse.


When a Fibonacci retracement is manually created, it is given a generated name by the MetaTrader platform.  For example, it may be named "Fibo 1003".


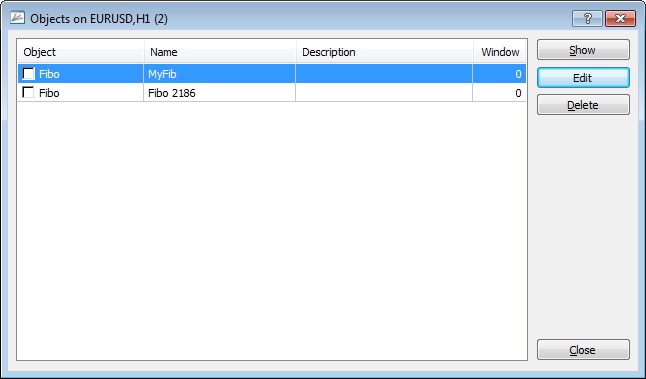
The Fibonacci Trader Plug-in identifies Fibonacci retracements by their name. To change the name of a manually drawn Fibonacci retracement, in the MetaTrader platform go to:

Charts->Objects->Object List


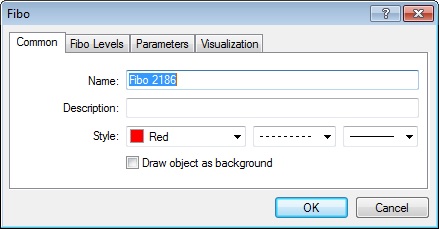
Find the Fibonacci retracement in the list, highlight it and select Edit.


This will allow changing the Fibonacci retracement properties including the name.  


Note: The name of each Fibonacci retracement should be unique. Do not place more than one Fibonacci retracement on the same chart with the same name.


Related Topics:
What is VTS
System Requirements
Installing VTS
Main Menu
Toolbox FUNCTIONS Pane
Expert Advisor Facts
Configure
PLATFORM Function
Custom Indicators
TRADETIME Manager
COMMUNICATION Manager
Message
Logic
MetaTrader Platform Configuration
Compiler
Compiler Flags
Platform
Editor
EA Output Folder
Custom Indicator Folder
fnOpenOrder
fnModifyOrder
fnCloseOrder
MetaTrader Platform
Journal Tab
Experts Tab
Expert Menu
MQL Help
Trade Tab
ECN Brokers
Logic
Candlestick Function Parameters
Candlestick Drawing
Using Easy Email with the fnSendEzEmail Function
Testing the Easy Email Connection
Objects on the MetaTrader platform
Manually drawing a trend line
Removing a trend line
Building an Expert Advisor to draw and manage a trend line
Script & Multi-Platform Plug-in
Building a MetaTrader Script
Using the Multi-Platform Feature
Client-Side Stops Plug-in
Emergency Stops
Using Client-Side Stops
Objects on the MetaTrader Platform
Removing a Fibonacci Retracement
Building an Expert Advisor to draw and manage a Fibonacci retracement
Signal Type: Element
Signal Type: Logic Condition
Using the Code Block Feature
EA-Indicator Price Chart
EA-Indicator Video
Chart Objects Plug-in
fnDrawHorizontalLine
fnDrawVerticalLine
fnDrawArrow
fnDrawThumb
fnDrawLabel
fnDrawText
fnDrawCheckSign
fnDrawStopSign
Chart Objects on a MetaTrader Price chart
Adding Symbols
EA Secure Configuration
Chart Execute Plug-in
Chart Execute Configuration
Chart Execute on Price Chart
Using Chart Execute
Chart Execute Notes
Pivot Points on a MetaTrader Price Chart
fnFileRead
fnFileWrite
fnDeleteFile
Multi Trade on a MetaTrader Price Chart
Using the Debug Manager Plug-in
MQL Event Documentation