Pivot Points on a MetaTrader Price Chart
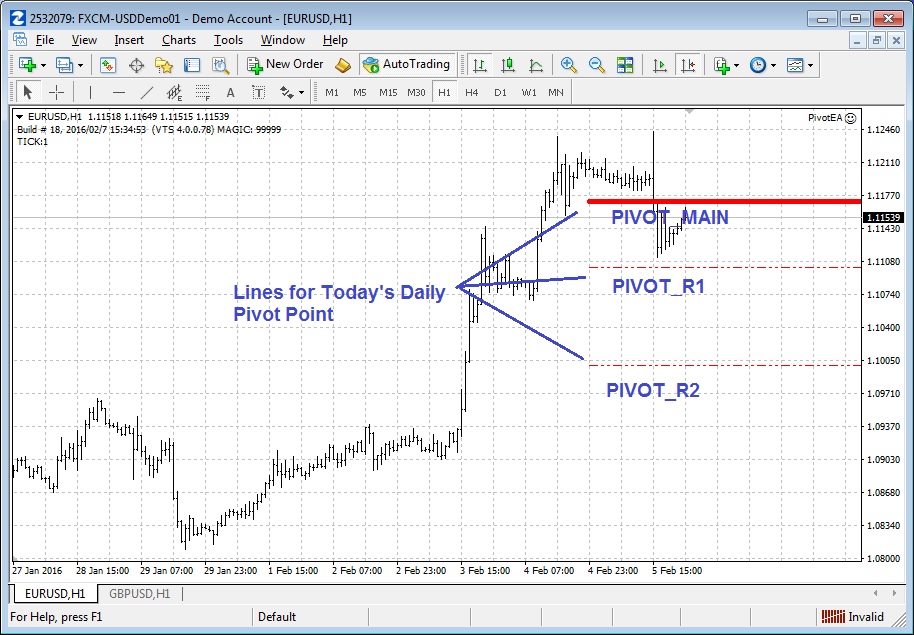
This price chart shows a Main, Resistance 1 and Resistance 2 pivot point lines.
Note that the lines Support 1 and Support 2 are not shown because their values lie outside of the chart highest price.
(In the case, the values are because of large upward movement in price.)

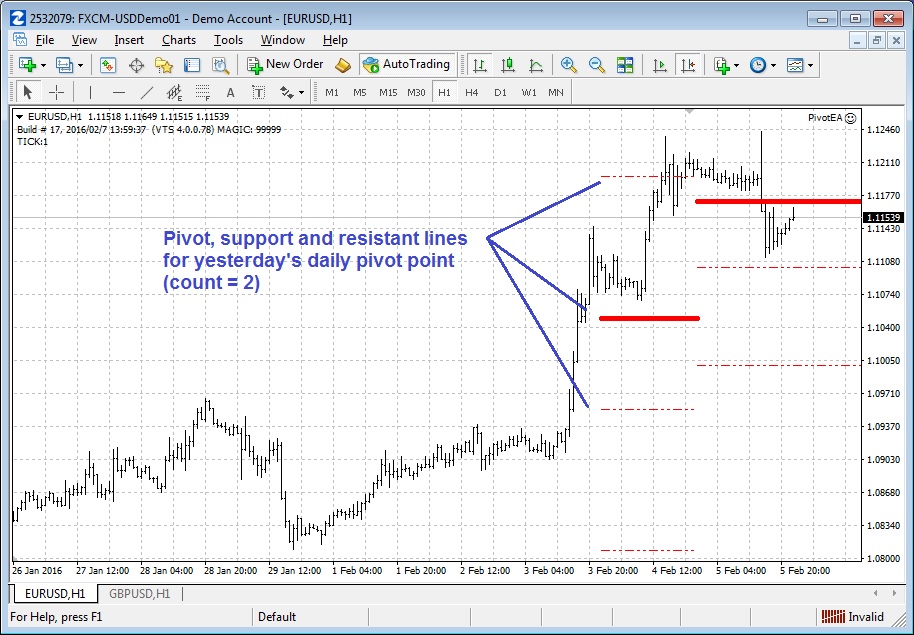
This price chart shows the pivot point lines for today and yesterday. The count parameter of fnDrawPivotPoints was set to 2.

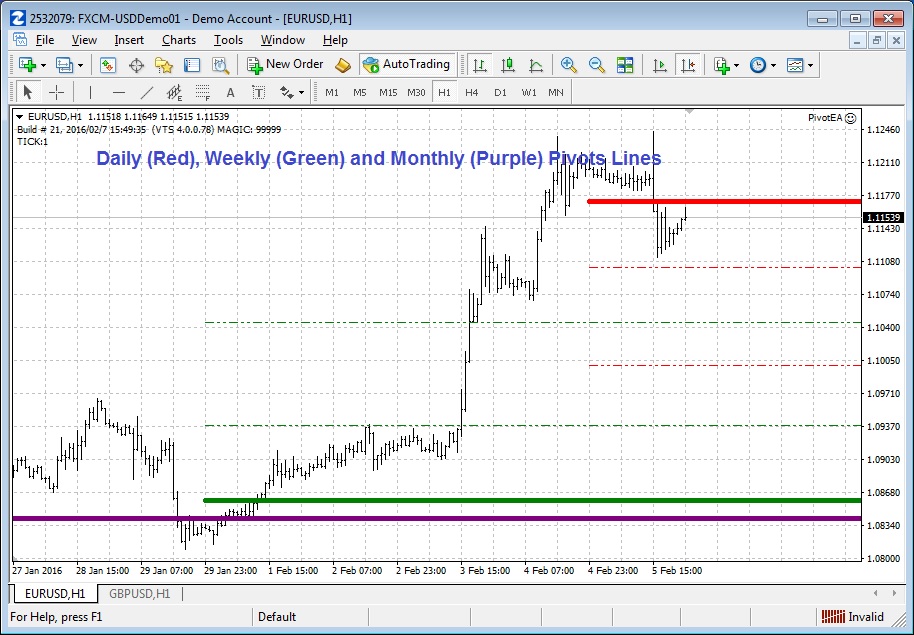
This price chart shows Daily, Weekly and Monthly pivot lines.


